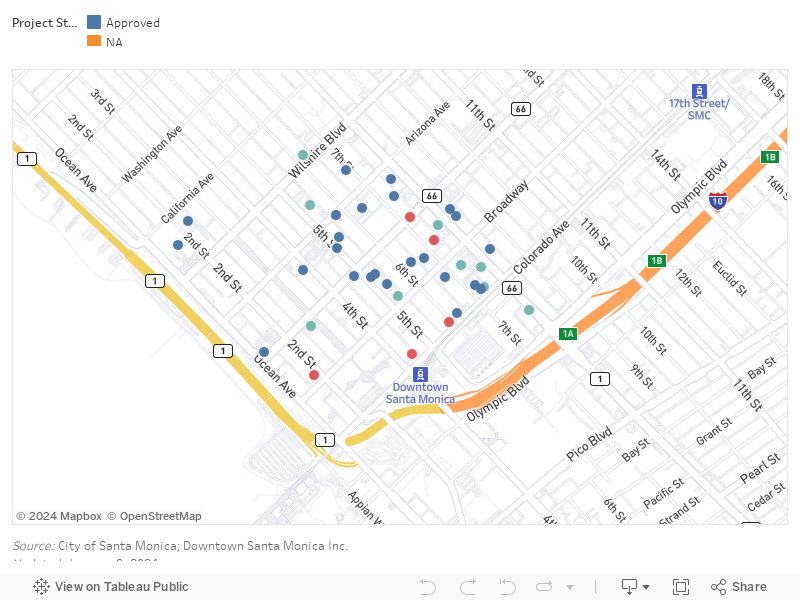
DTSM New Development
As of January 8, 2024, there were 39 new development projects. Nearly two-thirds of them have been approved, and approximately 23% of them are under construction.
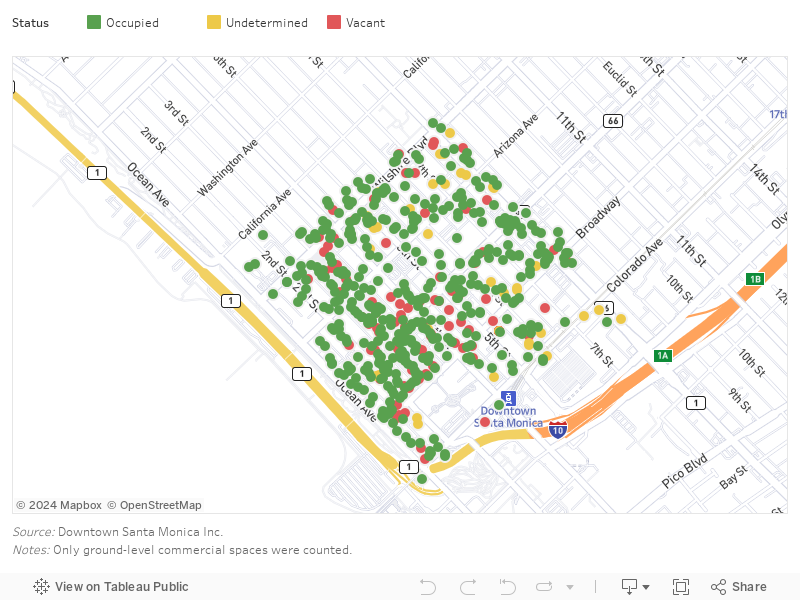
DTSM Retail Space Occupancy
As of February 27, 2024, there were 573 ground-floor commercial spaces in Downtown Santa Monica and 7.2% of their occupancy was undetermined. Among 532 spaces being determined for their uses, 81.4% were occupied.
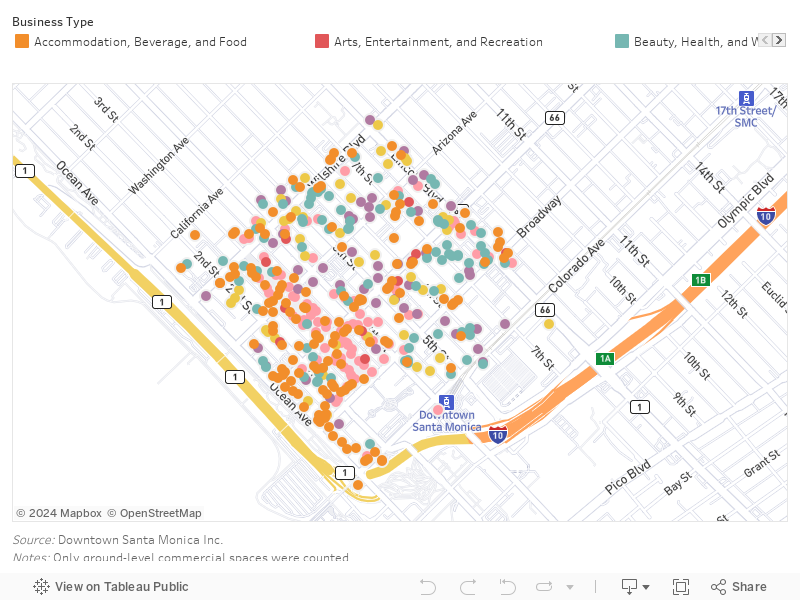
DTSM Business Types
As of January 8, 2024, there were 433 ground-floor businesses in Downtown Santa Monica. About a third of them were accommodation, beverage, and food, followed by retail (22.1%), and beauty, health, and wellness (20.1%).
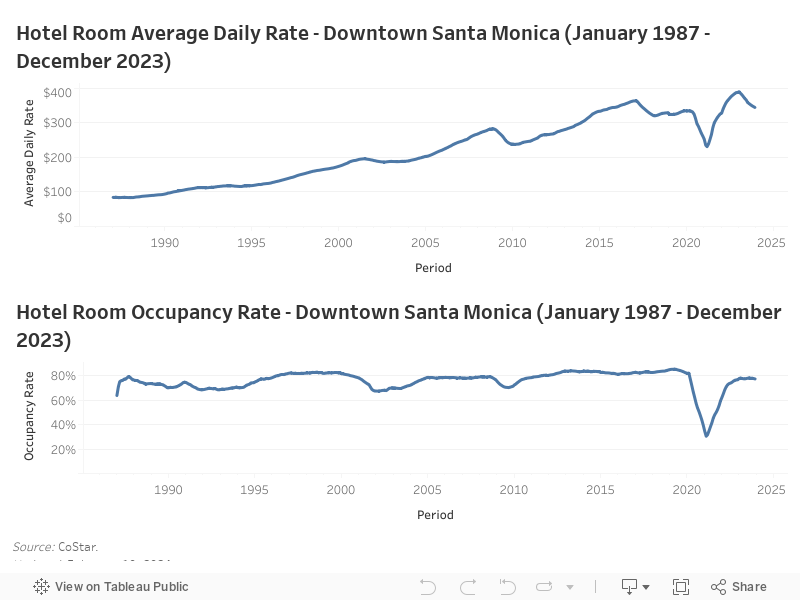
DTSM Hospitality
The average daily rate of hotels in Downtown Santa Monica in December 2023 was $344.
The hotel occupancy rate of Downtown Santa Monica in December 2023 was 77%, approaching the pre-COVID level in February 2020 (82%).
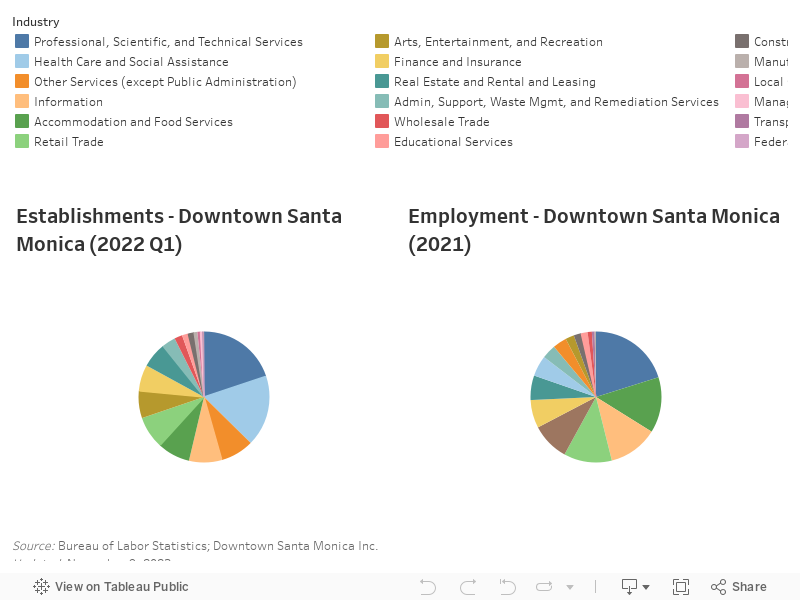
DTSM Business and Employment
The data from the first quarter of 2022 shows that Professional, Scientific, and Technical Services, Healthcare and Social Assistance, and Other Services accounted for nearly half of the business types in Downtown Santa Monica.
In 2021, roughly half of the workforce in Downtown Santa Monica was in the Professional, Scientific, and Technical Services, Accommodation and Food Services, and Information industries.
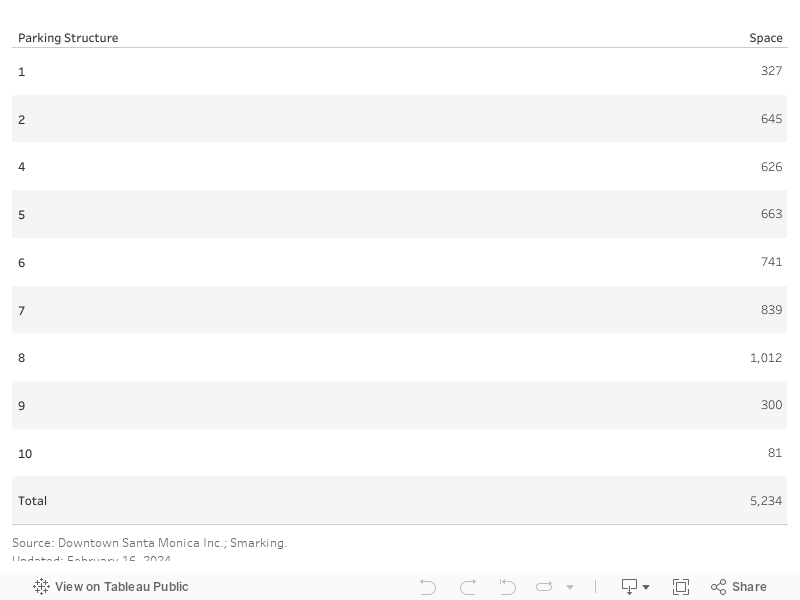
DTSM Parking
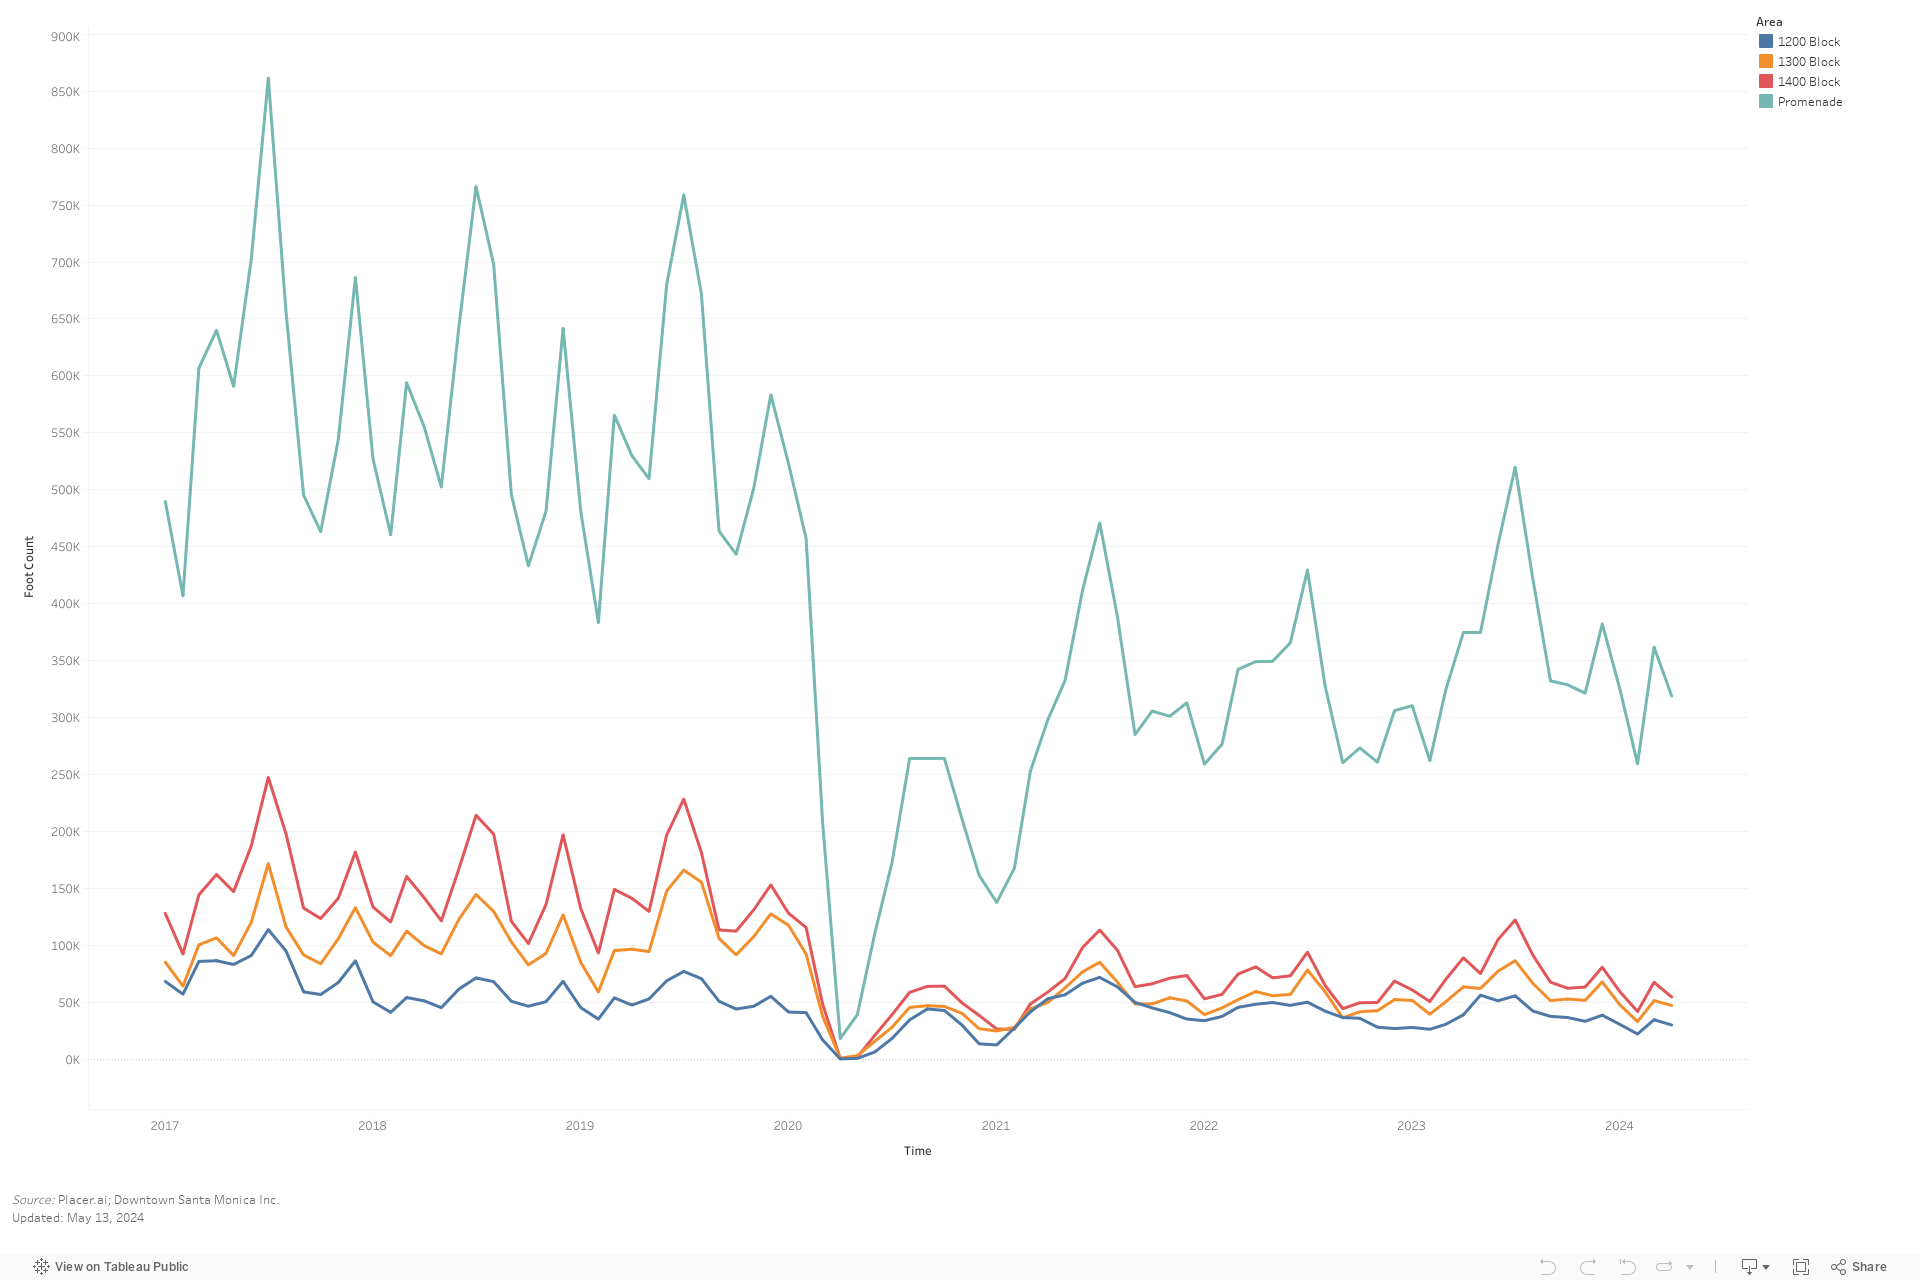
Promenade Foot Traffic
Pedestrian activity serves as a crucial gauge of downtown vitality. DTSM utilizes Placer.ai to meticulously track pedestrian traffic, thereby facilitating accurate estimations of the overall pedestrian engagement within this locale.
Much like numerous downtowns across the United States, the Third Street Promenade has experienced a decline in pedestrian activity over the last three years, attributed to the practice of remote work prompted by the pandemic and a decrease in tourist visits.
In February 2024, the Third Street Promenade saw an influx of 249,882 visitors, representing approximately 49% of the foot traffic observed in the pre-pandemic February of 2020.
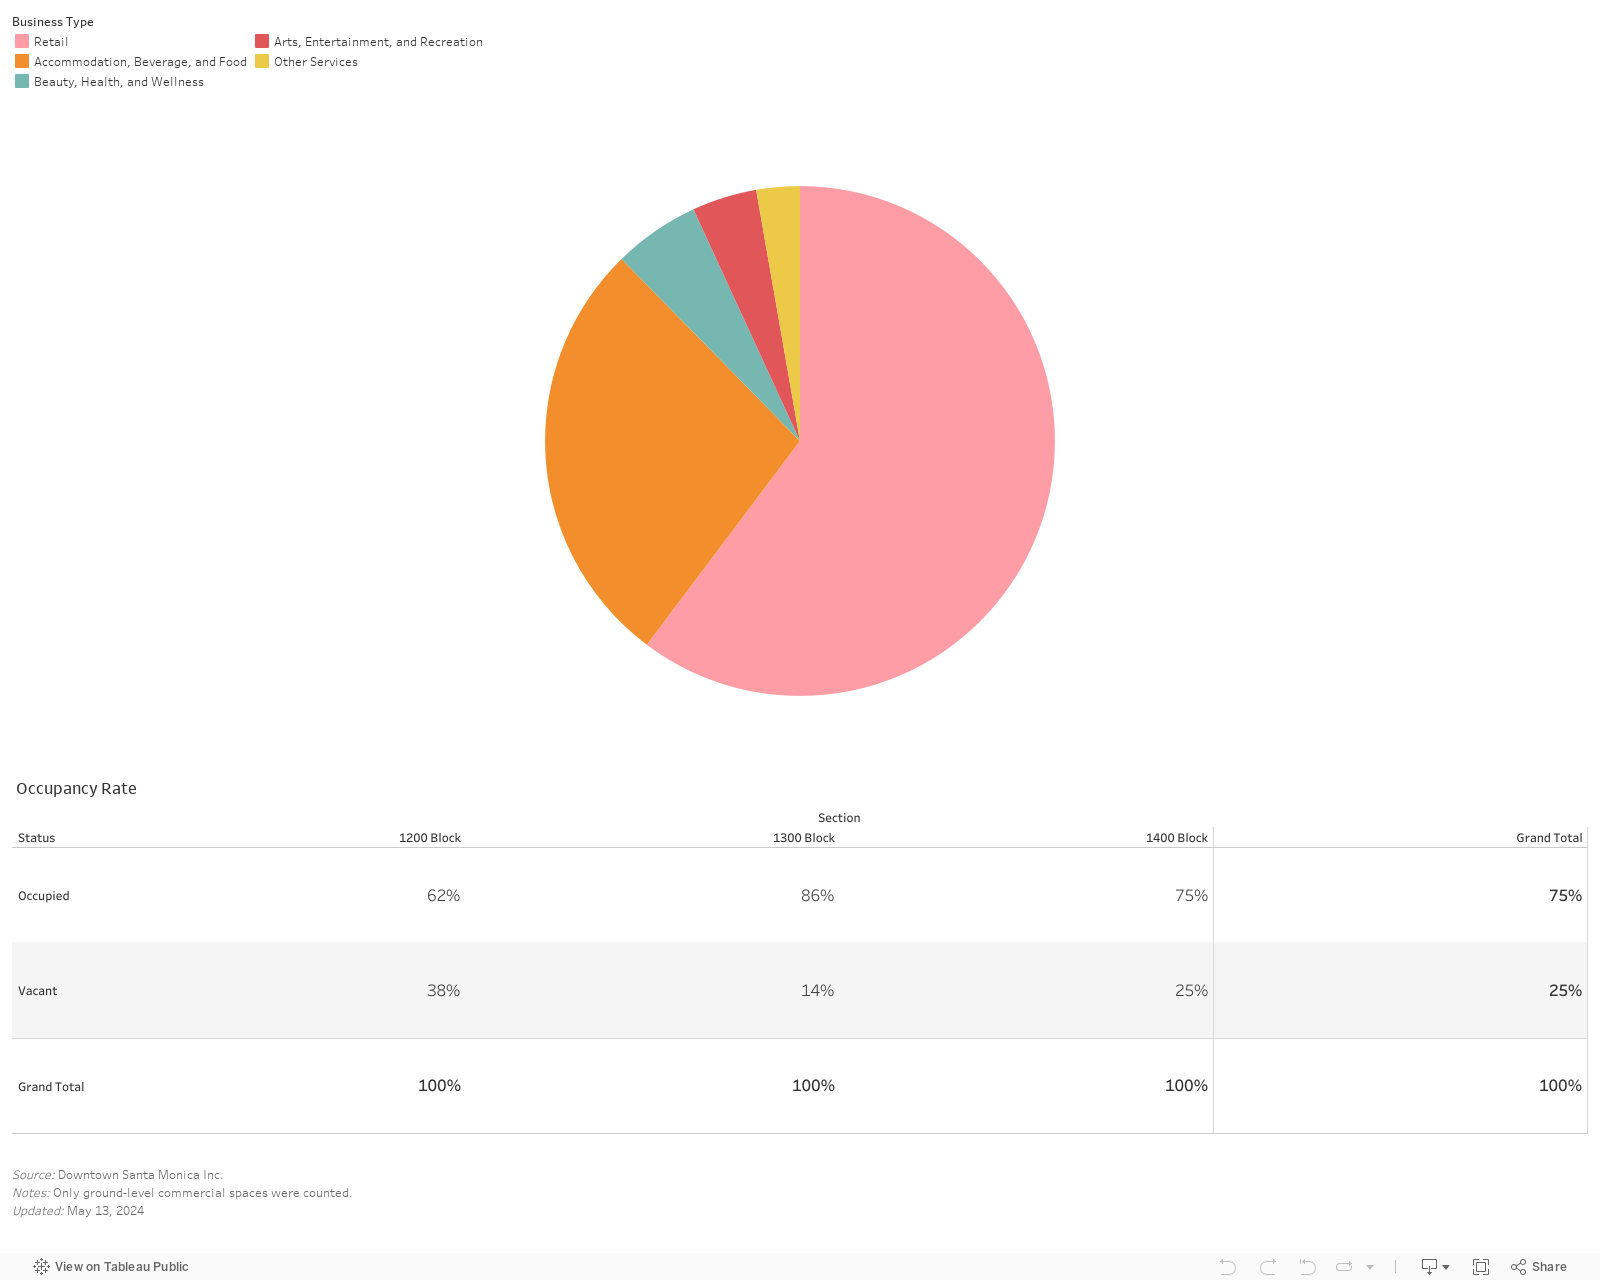
Promenade Business Types & Retail Space Occupancy
As of March 7, 2024, retail and accommodation, beverage, and food accounted for approximately 90% of all businesses.
The occupancy of commercial spaces on 1200, 1300, 1400, and the entire Promenade were 62%, 83%, 78%, and 76%, respectively.